Financial Market
Differentiate Between Common Stock and Preferred Stock
Common StockHistory The first Common stock ever issued by the dutch east india company in 1602. Meaning Shares entitling their holder to dividend that vary in amount and may even be missed depending on financial condition of the organization. Profit Common Stock holder’s earn profit in the shape of dividend which varies according to financial position of the organization. PROFIT = (CAPITAL GAIN + DIVIDEND) Risk Potential High Risk Easily Access Common stock can be easily traded on any trading platform. i.e Stock Market Voting Power They have voting power to elect board of directors and vote on corporate policies. Speculation Chances Here the speculation chances is high and investor purchase common stock on low price and sale it on high price. Redemption Or Callable Common stock is not callable or redeemed. Arrears Of Dividend Are not entitled to arrears of dividend if skipped in previous year. Insolvency Or Bankruptcy In case of insolvency common stock holder’s can claim on asset of the firm in last. i.e Creditors>Bond Holder>Preferred Stock > Common Stock |
Preferred StockHistory The first preferred stock ever issued in maryland internal improvement company in 1836(Transportation Company) Meaning Shares entitling their holder to a fixed interest amount whose payments takes priority over that of ordinary share’s dividend Profit Preferred stock holder’s earn profit in the shape of interest which means fixed amount and doesnot depending upon financial position of the organization. PROFIT = INTEREST AMOUNT RISK POTENTIAL Low Risk Easily Access Preferred stock are not easily available because less organization issued preferred stock. Voting Power They have no voting power in the organization Speculation Chances Here the speculation chances is minimum because only few firms issues these type of stock so they are limited in numbers. Redemption Or Callable Preferred stock is callable or redeemed if organization wants. Arrears Of Dividend Are entitled to arrears of dividend if skipped in previous year. Insolvency Or Bankruptcy In case of insolvency preferred stock holder’s can claim on assets of the firm before common stock holder. i.e Creditors > Bond Holders > Preferred Stock |
Financial Statement Analysis
Differences in accounting methods between companies sometimes make comparisons difficult.
- We use the LIFO method to value inventory
- We use the average cost method to value inventory.
Differences in accounting methods between companies sometimes make it difficult to compare their financial data. For example:
- If one company values its inventory using the LIFO method and another uses the average cost method, then direct comparisons of financial data such as inventory valuations and cost of goods sold may be misleading.
- Even with this limitation in mind, comparing financial ratios with other companies or industry averages can provide useful insights.
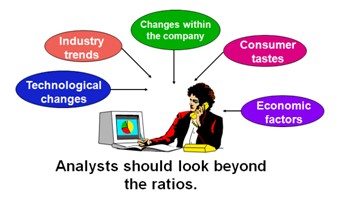
Analysts should look beyond the ratios.
Ratios should not be viewed as an end, but rather as a starting point. They raise many questions and point to opportunities for further analysis, but they rarely answer questions by themselves.
In addition to ratios, other sources of data should also be considered such as industry trends, technological changes, changes in consumer tastes, changes in broad economic factors, and changes within the company itself.
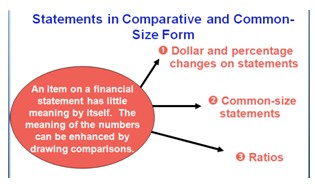
An item on a balance sheet or income statement has little meaning by itself. The meaning of the number can be enhanced by drawing comparisons. This chapter discusses three such means of enabling comparisons:
- Dollar and percentage changes on statements (also known as horizontal analysis),
- Common-size statements (also known as vertical analysis), and
- Ratios.
Horizontal analysis
Horizontal analysis (also known as trend analysis) involves analyzing financial data over time.
- Quantifying dollar changes over time serves to highlight the changes that are the most important economically.
- Quantifying percentage changes over time serves to highlight the changes that are the most unusual.
The dollar change in account balances is calculated as the current year figure minus the base year figure. The dollar amounts for two thousand four become the “base” year figures.
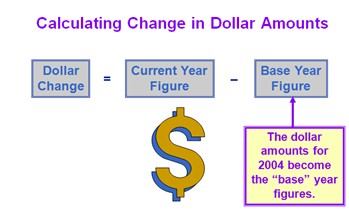
The percentage change in account balances is calculated as dollar change divided by the base year figure times one hundred percent.
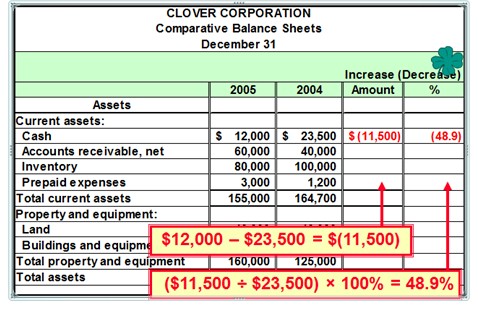
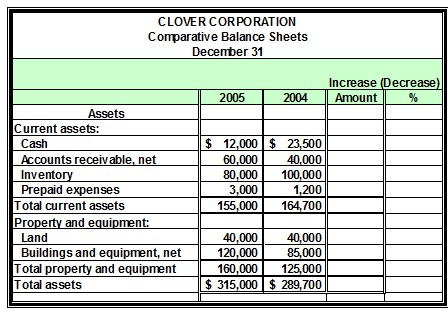
The dollar and percentage changes in the cash account are computed as shown.
The dollar and percentage changes for the remaining asset accounts are as shown. Can you calculate these numbers?
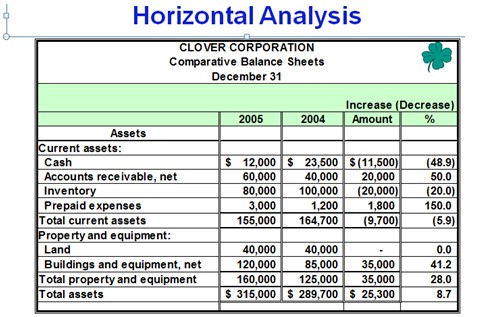
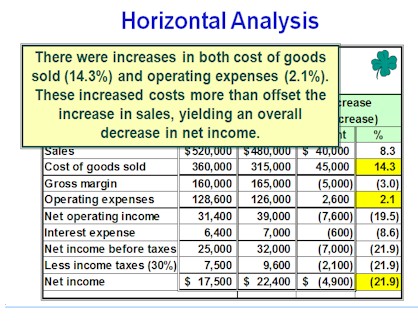
We could do this for the liabilities and stockholder’s equity, but instead let’s look at the income statement.
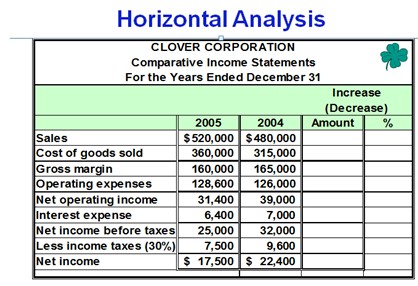
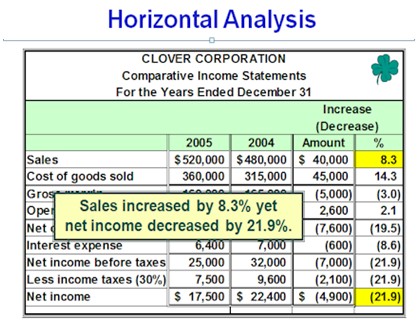
There were increases in cost of goods sold and operating expenses that offset the increase in sales. These increased costs more than offset the increase in sales, yielding an overall decrease in net income.
Ratio Analysis
Objectives: After reading this chapter, the students will be able to
- Construct simple financial statements of a firm.
- Use ratio analysis in the working capital management.
Balance Sheet Model of a Firm
Business firms require money to run their operations. This money, or capital, is provided by the investors. This is mutually beneficial to the firms and to the investors. The investors get a reasonable return on their investment, and the firms get the badly needed capital.
Generally speaking, the firms employ two forms of capital: the debt capital and the equity capital. The firms acquire the capital from two types of investors, the bondholders provide the debt capital and the stockholders the equity capital. From the perspective of the investors, the risk of these investments is different, the bonds being the safer investment relative to the stocks. Similarly, the firms bear more risk when they issue bonds, because the firms must pay interest on the bonds.
Consider a corporation that has no debt. Stockholders provide the entire financing of the company. We call it an all-equity firm. Figure 3.1 shows this as Firm A. This firm can borrow some money, by selling long-term bonds. From the proceeds of the sale of the bonds, it buys back some of its outstanding stock. Thus it can replace some equity with debt. Suppose it is able to do so in a judicious way so that its debt ratio, or debt-to-assets ratio, becomes 25%. Now it looks like Firm B in the diagram.
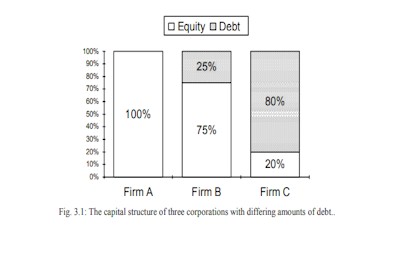
Occasionally, corporations get too far in debt. For example, Firm C in the diagram has 80% debt, which is too much. Such a company is always worried about its ability to pay interest to the bondholders. If it is unable to pay interest on time, the bondholders can force it into bankruptcy. It is the possibility of bankruptcy that makes it a risky company.
Figure 3.1 shows the relative amounts of money invested by the two types of investors, the stockholders, and the bondholders. Their stakes in the company are represented by the two areas, white and gray. We know that the company should employ the debt and the equity in proper proportions. Too much debt can lead to financial failure of a company.
The capital is invested in the assets of the firms. If the debt capital is B, and the equity capital S, then the total capital of the company is B + S. This must also be equal to the total value of the company, V,
V = B + S (3.1)
Now we may look at the financial condition of a company from a different angle. This time we look at its balance sheet. The balance sheet of a company lists its assets and liabilities at a particular time. For example, we may be looking at the balance sheet of a company as of December 31, 1998. The stockholders equity, or just equity, by definition, is
Stockholders Equity = Assets − Liabilities (3.2)
When a corporation is set up, it clearly spells out the rights and expectations of both types of investors. The bondholders are lending their money to the corporation at a certain rate of interest. They expect to receive their interest on time, along with the final payment of the bonds when they mature. The stockholders cannot demand dividends from the firm. The stockholders, even though they are owners of the firm, have limited liability in case the company gets into serious financial or legal difficulties. They are also the holders of a call option on the assets of the firm, with an exercise price equal to the face value of the bonds of a company. In case of liquidation, they receive whatever the company is left with after all other creditors are satisfied. In this sense, they are the last ones in line to receive the benefits from the company. This concept leads us to equation (3.2). We may rewrite this equation as
Assets = Liabilities + Equity (3.3) Now we may
This is exactly the same as (3.1). The above equation may also be represented by a pie chart, with two pieces belonging to the stockholders and bondholders. The total value of the assets of the firm is simply the whole pie, the sum of liabilities and equity. What makes up the assets of a firm? First, the obvious physical ones: buildings and lands; factories and warehouses; machinery and equipment; inventories of merchandise and finished goods. Second, we consider the financial assets: money in checking accounts and marketable securities; the money it expects to receive from its customers. The less obvious assets include the expertise of its managers, the quality of its products, and the reputation of its brand name.
The liabilities of a firm include the money it has borrowed from bondholders, and other lenders. It also includes the money it owes to its suppliers, or any other unpaid bills. Accountants spend a considerable amount of effort in classifying and measuring the assets and liabilities of a corporation.
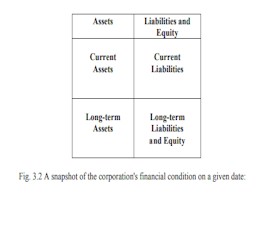
One way to classify the assets and liabilities is whether they are long-term, or short-term. The distinction between long-term and short-term is rather arbitrary. Generally, the assets that are going to last for more than a year are considered to be long-term assets. Similarly, long-term liabilities are due after more than a year. Based on this differentiation, we may slice the balance sheet into four quadrants, as indicated in the following diagram. Again, it is just an aid in visualizing the capital structure of a corporation, with the added dimension of time.
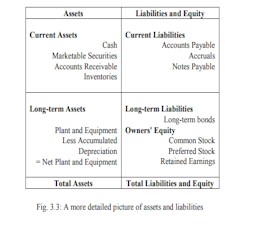
Figure 3.3 shows the financial condition of a company in terms of its assets and liabilities, but classifying them whether they are short-term or long-term.
Next, we try to fill out additional details in the picture. We may do so by looking at the assets and liabilities more closely. In the above table, the assets are listed in order of their accounting liquidity, that is, the ease with which the assets can be converted into cash.
Cash is the lifeblood of a corporation. If a company does not have enough cash on hand to pay its workers on time, or its suppliers, it can run into serious problems. This can lead to a liquidity crisis, otherwise known as a cash crunch. Careful management of the cash position of a company is one of the basic problems in the working capital management.
Let us revisit equation (3.3) to develop another important concept, namely the cash equation. Let us write
Assets = Liabilities + Equity (3.3)
as follows:
Cash + Current assets (except cash) + Fixed assets = Short-term liabilities + Long-term debt + Equity
Rearranging terms, we find
Cash = Short-term liabilities + Long-term debt + Equity − Fixed assets − Current assets (except cash) (3.4)
The above equation isolates cash as one factor, and the other financial parameters that cash depends upon. By examining the above equation we notice, for example, increasing long-term debt and equity will increase the cash position of a company. Further, increasing the fixed assets, or the net working capital (except cash) will decrease the cash position of a company.
Net Working Capital
By definition, the net working capital of a company is the difference between the current assets and the current liabilities of a firm:
Net working capital = Current assets – Current liabilities (4.1)
The changes in current assets and current liabilities will create a change in the net working capital of a company. We also recall that the four main items in the current assets of a firm are: (1) cash, (2) marketable securities, (3) accounts receivable, and (4) inventories. The three principal items in the current liabilities are (1) account payable, (2) accrued wages, taxes, and other accrued expenses, and (3) notes payable. Any change in these seven items will lead to a change in the net working capital of a corporation.
Ratio Analysis
It is possible to look at the financial health of a corporation by looking at some of its key financial ratios. Ratio analysis can also be used as a diagnostic tool to find the sources of financial trouble at a company.
The ratios may be divided into these types:
- Liquidity ratios, that look at the availability of cash for operations.
- Asset management ratios evaluate the efficient utilization of the resources.
- Debt management ratios keep track of debt to be within reasonable bounds, and keep the debt level at its optimal level.
- Profitability ratios measure the degree of accounting profits.
- Market value ratios help investors discriminate between overvalued and undervalued securities while making investment decisions.
Let us review these ratios and their significance.
Liquidity Ratios:
First we look at the liquidity ratios of a company. These ratios focus on the availability of cash to manage the day to day operations of the company. In particular, we define the current ratio as
Quick, or Acid Test = inventories-Current assets / Current liabilities
Asset Management Ratios:
The asset management ratios evaluate the efficiency of use of the principal assets of a company, such as its inventory.
Inventory Turnover = Cost of goods sold / Inventories (average)
This ratio measures the efficient use of inventories. A firm should have a high turnover ratio, which is managed through a small amount of inventories. This means that a firm should have a small inventory and try to sell it as quickly as possible. Unfortunately, a small inventory also means lower sales.
Closely related to the inventory management is the management of receivables. A company should have a small amount invested in the receivables. That is, the company should try to sell the goods for cash. To measure the efficiency of this operation, we define the Days Sales Outstanding as
Days sales outstanding = Receivables / Sales per day
A broader measure of the efficiency of use of assets is the fixed assets turnover. This ratio is defined as follows.
Fixed assets turnover = Annual sales / Net fixed assets (average)
Some corporations have a huge investment in fixed assets, plant and equipment. This is the case of electric utilities or real estate investment trusts, for instance. Other corporations, such as software development companies, may have a rather small investment in equipment. It is proper to compare firms with one another that are in the same line of business.
A broader measure of asset utilization is the following ratio
Total assets turnover = Annual sales / Total assets (average)
This ratio looks at the aggregate assets of a company and measures the way the company utilizes them.
Debt Management Ratios:
The corporations borrow money to do their business because debt capital is cheaper than the equity capital. On the other hand, excessive amount of debt can create problems for the company. To see the debt level of a company, we define its debt ratio, or leverage ratio as follows
Debt ratio = Total debt / Total assets
Of course, the companies must maintain their debt at an optimal level.
Another ratio that looks at the ability of a company to pay its interest when due is its interest coverage ratio, or times interest earned. This is defined as
Interest coverage = EBIT / Interest charges
If this ratio is 4, then for each dollar of interest due, the company has $4 available. This is a fairly safe ratio, and the probability of default is quite low
Profitability Ratios:
The next set of ratios measure the ability of a company to generate profits. These ratios are of interest to investors who would like to invest in the most profitable companies around. The first ratio is the net profit margin, defined as
Net profit margin = Net income / Total operating revenue
In this ratio, net income is defined to be the income after taxes, available to the stockholders of the company.
The next ratio looks at the profitability from the point of view of the management of a firm. In this case the denominator is EBIT, meaning earnings before interest and taxes. If the EBIT is too small, then the financial managers at a corporation will have difficulty in paying the interest on time. We define gross profit margin as follows:
Gross profit margin = EBIT / Total operating revenue
Another ratio that the investors like to review is net return on assets. We may define it as
Net return on assets= Net income / Total average assets
The similar ratio that the management wants to review is gross return on assets, defined as follows
Gross return on assets= EBIT / Total average assets
The stockholders are particularly interested in the following three ratios. First, return on common equity, that measures the return to the stockholders on stockholders' investment in the company. This is defined as
Return on common equity = Net income to stockholders / Average common equity
Second, is the dividend payout ratio. This represents the fraction of money paid to the stockholders out of the income after taxed. We may define it as
Dividend payout ratio = Total cash dividends / Net income
The dividend payout ratio is important to the management as well. They cannot afford to pay large dividends when the company needs the money to finance new profitable projects. The growth of a company depends upon the retention rate, that is, the money that is not paid out as dividends. So, we define the third quantity, the sustainable growth rate as
Retention ratio´Sustainable growth rate = ROE
where ROE stands for the return on equity for a firm
Market Value:
From an investor's point of view, it is important to see the difference between the market value of the stock of a company, and its accounting value, or book value. To get a perspective on this difference, we define the Market/Book ratio as
Market/Book ratio = Market price,share / Book value,share
The investors hunting for bargains like to see this ratio as small as possible. We complete our list by including two more ratios, defined as follows:
P-E ratio = Market price,share / Earnings,share
And
Dividend yield = Dividend per share / Market price per share
Sources of Information
By far the best source of information is the Internet. Once you are able to surf the net, you can reach over and get the financial news and information about companies from several sites. The information is quite reliable, current, and accurate. If you cannot find it on the Internet, there are still several print media to fall back on. The information about Microsoft was taken from the Internet. You may want to check the following sources:
|
Internet http://www.cboe.com |
The Wall Street Journal The New York Times Value Line Investment Survey Standard and Poors |
Notes of economics Chapter-1
Capital Markets
Financial Market